
Summary
Visualize and organize critical PDM data in real time using SOLIDWORKS Manage Dashboards.
When analyzing your Engineering data, it’s important to be able to quickly and efficiently be able to identify and organize critical data. TriMech offers several tools to help you take control of your data and provide your companies with advanced ways to organize and monitor your engineering and project data. Two of those tools are SOLIDWORKS Manage and SOLIDWORKS PDM. SOLIDWORKS Manage has the tools to integrate with and improve your existing SOLIDWORKS PDM environment. One of my favorite tools in SOLIDWORKS Manage is the dashboard module. With Dashboards you can easily isolate and visualize critical information in real-time from your PDM environment using fully customizable portlets
Bringing your PDM data into a SOLIDWORKS Manage Dashboard
Manage Dashboards allow you to pull in data from any of your Manage portlets using the Manage Data Wizard and custom SQL Queries in the Data Source Wizard.
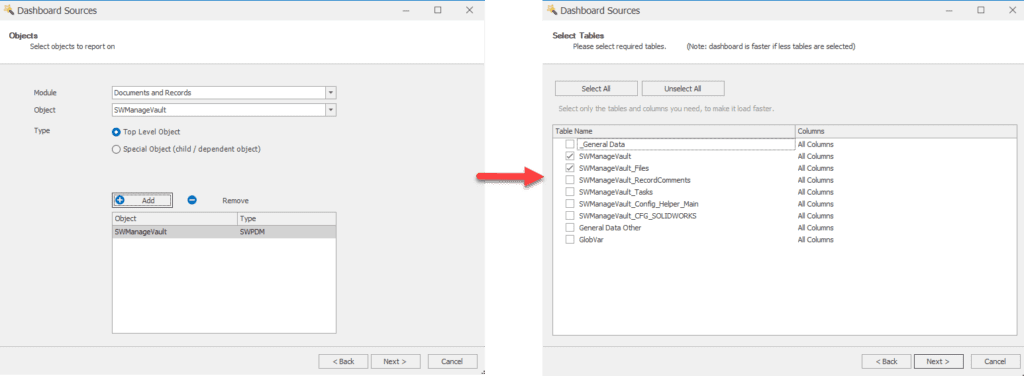
Use the Data Manage Wizard to pull Manage information from relevant data sources and tables.
SOLIDWORKS Manage Dashboard
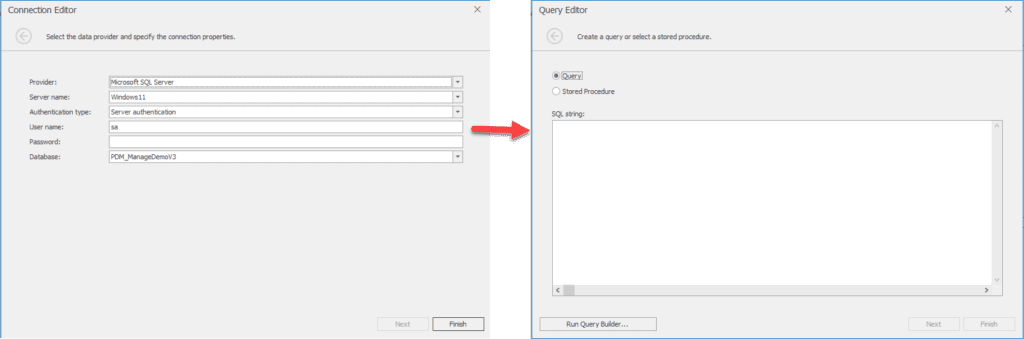
Use the Data Source Wizard and Query Editor to create custom SQL queries and create calculated and custom field information.
 Data Source Wizard and Query Editor
Creating Grids in a Manage Dashboard
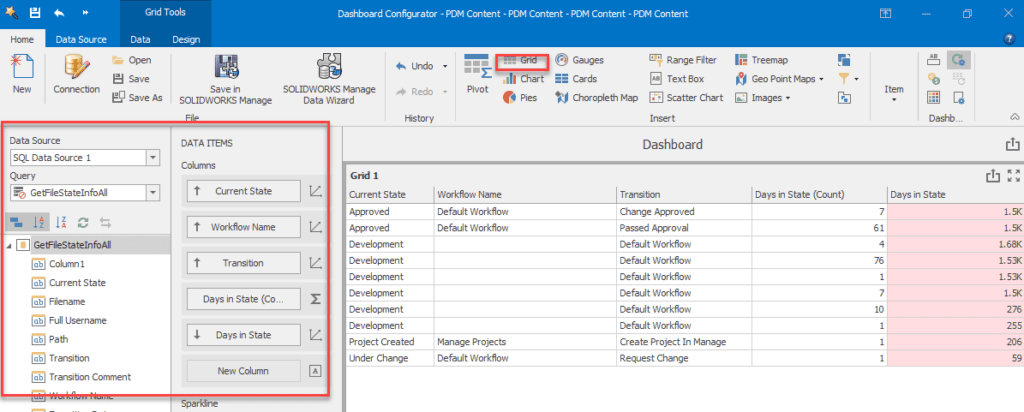
Grids are useful for organizing data and adding filters and format rules simply click on the grid button to create a grid portlet and drag values from the data source tree to the columns section to create a custom grid.
Creating Grids in a Manage Dashboard
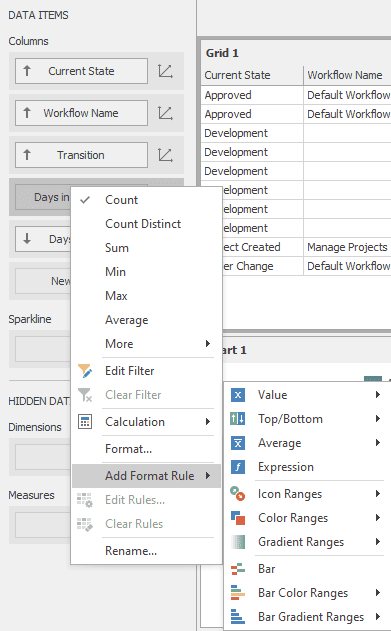
Right click on a column to customize with custom filters and format rules. Rules can be customized to turn cells different colors when they reach certain values, thresholds, or calculations.
 column to customize with custom filters
Create custom data portlets
SOLIDWORKS Manage Dashboard can organize data using several custom portlet types. Data can be organized into charts, pie graphs, gauges, tree maps, and much more. Once in those charts, data can be made interactive and update information across other portlets.
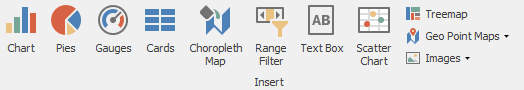
Create custom data portlets
Drag in data fields and arguments to create charts and graphs that can then be used to filter your grid data using single and multiple master filters.
 Drag in data fields
You can learn how to export BOM data as XML using SOLIDWORKS Manage by reading this article.